
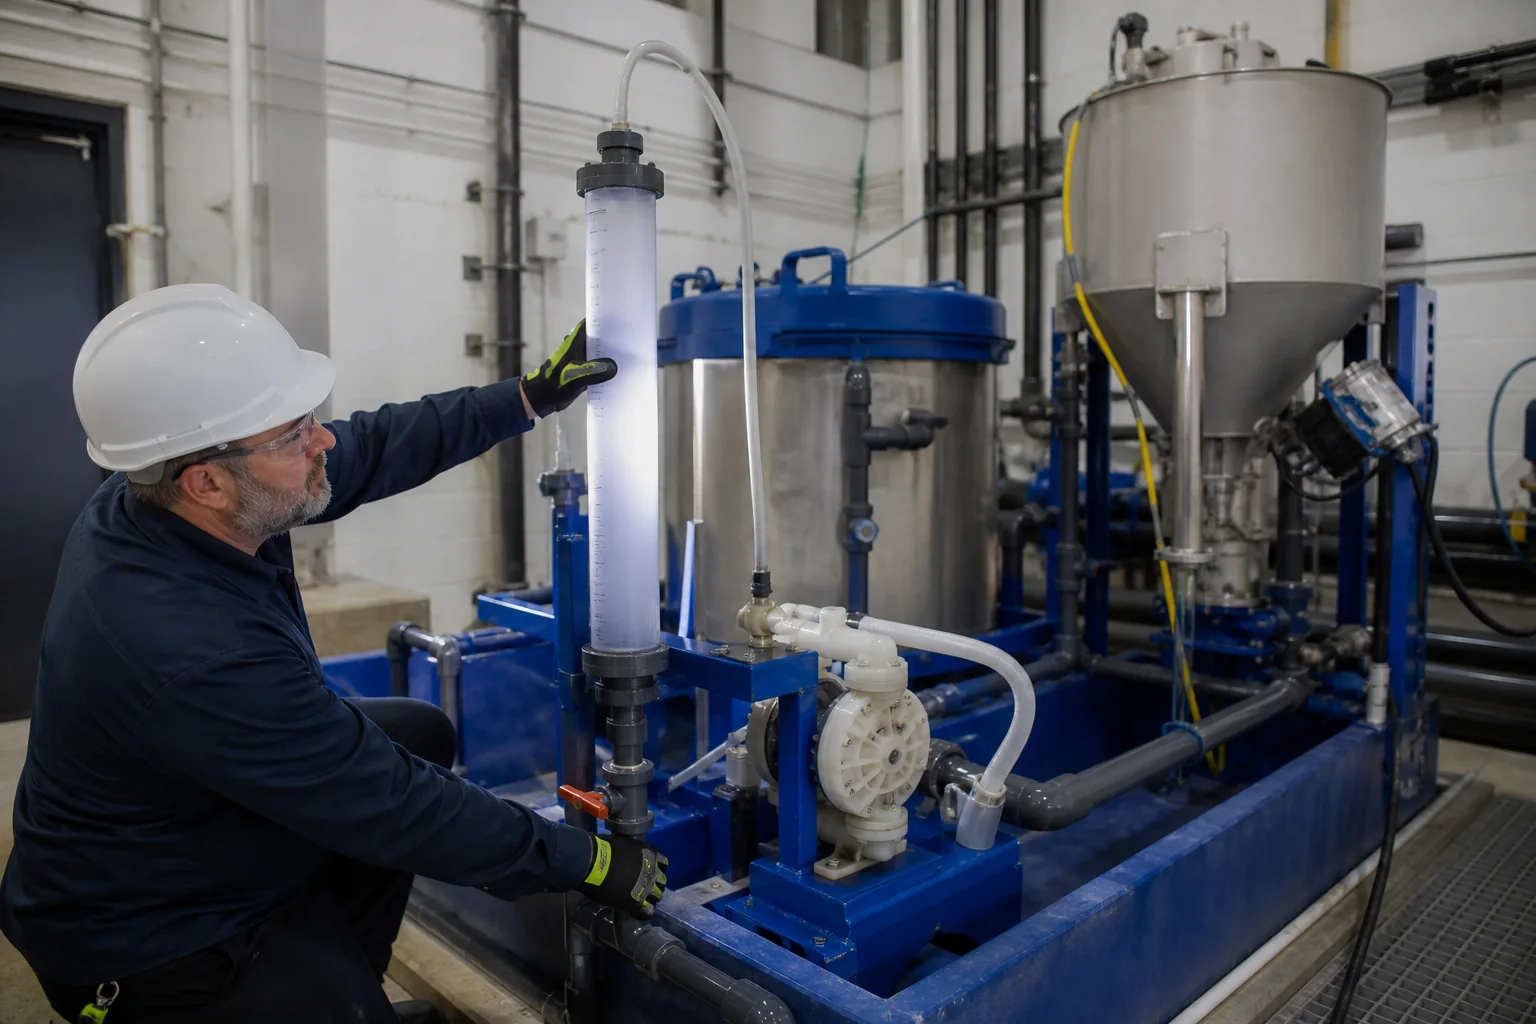
A PAM flocculant pump setting is not a dose. Calibration connects the actual stock-solution flow, active concentration and process flow so operators can compare products and recognize feed-system faults.
Confirm the stock concentration
Calculate dry product mass divided by total solution mass or volume using the site method. Record whether the value is as-supplied or active basis. Check feeder and water-flow calibration instead of relying only on controller set points. A nominal 0.1% solution can be materially different when powder bridging or water-flow error occurs.
Measure actual pump delivery
Use a calibration column or a safe timed draw-and-weigh method approved for the system. Run the pump at several representative settings and record delivered volume per time. Repeat against expected discharge pressure because some pump types lose capacity as backpressure or component wear changes.
Calculate active dose for water flow
Convert stock solution flow to active polymer mass per hour, then divide by water flow. Keep units explicit. If stock concentration is expressed as kilograms active per cubic metre and solution flow as cubic metres per hour, their product is kilograms active per hour.
The numerical identity between mg/L and g/m³ makes this calculation convenient, but the stock concentration must be correct. Recalculate when water flow changes.
Calculate dose for sludge
Determine dry-solids throughput from wet sludge flow, density and solids fraction. Divide active polymer kilograms per hour by dry-solids tonnes per hour.
Check turndown and pulsation
A pump operated below its reliable turndown may deliver erratically. Pulsation can create alternating underdose and overdose even when the hourly average appears correct. Observe injection, use appropriate dampening where designed and match pump size to the normal flow range.
Inspect the injection system
Confirm dilution-water flow, non-return valves, injection quill condition and line flushing. A partially blocked line increases pressure and reduces delivery. Locate the point where polymer reaches the process and determine whether downstream mixing distributes it without destroying floc.
Establish a calibration routine
Calibrate after maintenance, hose or diaphragm replacement, concentration changes and whenever the mass balance does not match inventory. Keep a simple table of pump setting, backpressure, measured flow, stock concentration and calculated active dose. This record is essential when comparing PAM suppliers.
The U.S. EPA metal-finishing field manual treats polymer dose, feed concentration, jar tests and mixing intensity as core flocculation controls. EPA field manual.
Follow a worked water-treatment example
A stock solution contains 1.0 kg active polymer per cubic metre. The calibrated solution feed is 0.75 m³/h, so active polymer feed is 0.75 kg/h. If process flow is 500 m³/h, active dose is 0.75 × 1,000 ÷ 500 = 1.5 mg/L. The calculation is illustrative; the correct dose must come from the actual water and trial.
Follow a worked sludge example
Wet sludge flow is 20 m³/h, density is approximated at 1.0 t/m³ and dry solids are 2.5%, giving 0.50 t DS/h. If active polymer feed is 3.0 kg/h, dose is 6.0 kg/t DS. If sludge solids fall to 2.0% with unchanged pump settings, dose rises to 7.5 kg/t DS. This is why solution flow alone can conceal overdosing.
Match calibration to pump type
Progressive-cavity, diaphragm and peristaltic pumps have different wear, pulsation and pressure behavior. Use the equipment manufacturer’s safe calibration method. Inspect hoses, stators, check valves and diaphragms at appropriate intervals. Do not assume a linear relationship between controller percentage and flow without measurement.
Account for post-dilution
Activated stock is often diluted again near the injection point to improve distribution. Post-dilution does not change active mass, but it changes total liquid flow and mixing. Record both stock feed and dilution water. Loss of dilution water can create concentrated contact, poor dispersion and apparent overdose even when active feed is unchanged.
Verify flow instruments
Compare flowmeter readings with an independent timed calibration where safe and practical. Confirm units, scaling and totalizer settings after maintenance. A meter configured for litres per minute but interpreted as litres per hour can create a severe dosing error.
Build an automatic control boundary
Flow pacing can maintain a nominal mg/L dose, while sludge-solids pacing can maintain kg/t DS. Either control needs valid measurement and upper and lower limits. Feedforward control should not replace water-quality or dewatering checks because particle demand can change at constant flow.
Record uncertainty
Stock concentration, pump flow, process flow and solids analysis each have error. Use realistic significant figures and repeat measurements. If two products differ by less than the combined measurement uncertainty, do not claim a meaningful dose advantage from one short trial.
Close the loop with inventory
Compare calculated daily dry-product use with bags emptied or tank level. Investigate persistent differences. A reconciled mass balance gives purchasing a credible monthly consumption forecast and gives operations confidence that pump calibration remains valid.